Jarvis
  • CATEGORIES
    • Equity Markets
    • Investing Basics
    • AI for investing
    • Trending Stock Market News: Quick Reads
    • Portfolio Management
    • Stock Market News Updates
    • Global Stock Market
    • Stock Advisory
  • I AM A
    • Beginner
    • Intermediate
  • Home
  • Products
    • Jarvis Portfolio
    • Jarvis Protect
    • Jarvis OneStock
    • Jarvis Prime – For HNIs & UHNIs
    • Jarvis Sentiment Tracker – AI Tool for F&O
    • Jarvis US Multi-Asset Portfolio
    • Jarvis Atlas
  • FAQs
  • About Us
  • Contact Us
  • Become a Partner
No Result
View All Result
Jarvis
  • CATEGORIES
    • Equity Markets
    • Investing Basics
    • AI for investing
    • Trending Stock Market News: Quick Reads
    • Portfolio Management
    • Stock Market News Updates
    • Global Stock Market
    • Stock Advisory
  • I AM A
    • Beginner
    • Intermediate
  • Home
  • Products
    • Jarvis Portfolio
    • Jarvis Protect
    • Jarvis OneStock
    • Jarvis Prime – For HNIs & UHNIs
    • Jarvis Sentiment Tracker – AI Tool for F&O
    • Jarvis US Multi-Asset Portfolio
    • Jarvis Atlas
  • FAQs
  • About Us
  • Contact Us
  • Become a Partner
No Result
View All Result
Jarvis
No Result
View All Result
Home Equity Markets

Nifty vs the Average Investor’s Portfolio – Why Returns Can Look Different

by Sumit Chanda
November 19, 2026
in Equity Markets
Reading Time: 11 mins read
A A
0
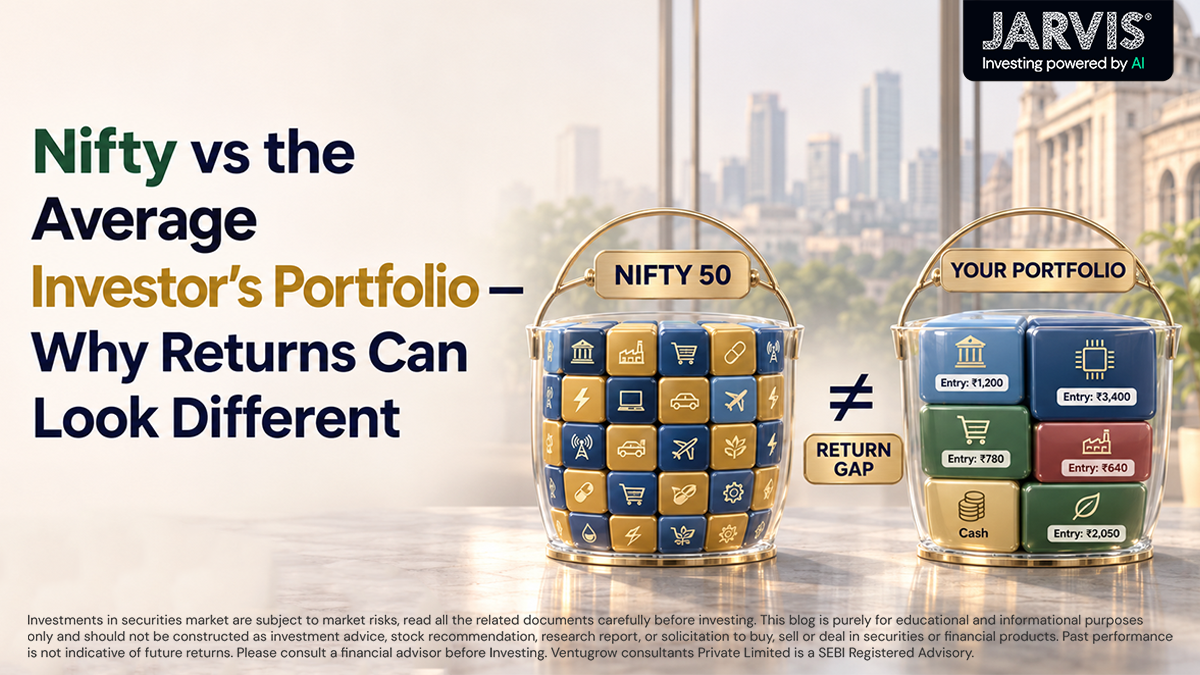
Nifty vs the average investors portfolio   why returns can look different

Nifty vs the Average Investor’s Portfolio - Why Returns Can Look Different

Share on FacebookShare on Twitter

The Nifty 50 is rising, but your investment portfolio may still be showing losses. Some stocks are underperforming, mutual fund returns look disappointing, and your overall investment performance does not match market headlines. This is a common experience among Indian investors.

The reason is simple: the Nifty 50 and an individual investor’s portfolio are not the same. While the index tracks 50 major companies, actual portfolio returns depend on stock selection, investment timing, sector allocation, expenses and investor behaviour.

1. The Nifty 50 Does Not Represent the Entire Market

The Nifty 50 tracks 50 large and liquid companies across different sectors of the Indian economy. However, these companies do not contribute equally to the index. It follows a free-float market-capitalisation-weighted methodology, giving larger companies a greater influence on index movements.

For example, if heavyweight banking and IT stocks perform strongly, they can lift the Nifty even when several other stocks are declining. An investor holding mid-cap, small-cap or non-index stocks may experience completely different returns.

This difference becomes more visible during sector-specific rallies. A strong performance from a few heavyweight companies can make the broader market appear healthier than it actually is. The Nifty is therefore a useful benchmark, but it does not represent every listed company. 

2. Stock Selection Can Change Your Returns

Two investors participating in the same market can generate very different returns simply because they own different stocks. Consider an investor whose portfolio is concentrated in banking and technology companies.

If these sectors underperform while automobile sector, pharmaceutical sector or capital goods rally, the investor may miss a significant portion of the market’s gains. The opposite can also happen. A portfolio holding companies from outperforming sectors may beat the Nifty during a particular period.

However, short-term outperformance does not guarantee consistent results. Company earnings, valuations, management quality, debt levels and industry conditions all influence individual stock performance.

Investors should therefore look beyond popular stocks and understand whether their portfolio holdings have strong business fundamentals and reasonable valuations.

3. Investment Timing Makes a Significant Difference

The Nifty’s return is generally calculated between two specific dates. Investors, however, may invest their money at different points throughout the year. Imagine the Nifty gains 12% over a year.

An investor who invested a lump sum near the beginning of that period may capture much of the gain. Someone who invested most of their money near a market peak could experience significantly lower returns.

This is particularly relevant for systematic investment plan (SIP) investors. Since investments are made at different prices and dates, actual returns depend on the timing and amount of every instalment.

XIRR is useful for evaluating investments involving multiple cash flows because it considers both the amounts invested and their respective dates. It gives investors a more realistic picture of their actual investment experience than simply comparing two market levels.

4. Price Returns and Total Returns Are Different

Another commonly overlooked reason for the difference is dividend income. The Nifty 50 Price Return Index reflects changes in stock prices but excludes regular dividends. The Nifty 50 Total Returns Index (TRI), on the other hand, includes dividends and assumes they are reinvested.

This distinction matters when comparing portfolio performance with the index. An investor holding dividend-paying stocks receives income that may not be reflected in the headline Nifty figure. Therefore, investors should compare equivalent return measures.

For example, an equity mutual fund’s performance should generally be compared with the relevant TRI benchmark rather than the price index. This provides a fairer assessment of investment performance. 

5. Costs and Investor Behaviour Affect Performance

Brokerage, transaction charges, fund expenses and taxes can reduce an investor’s final returns. Frequent buying and selling can increase these costs and affect overall portfolio performance. Investor behaviour also plays an important role. Many investors purchase stocks after sharp rallies because of fear of missing out and sell during corrections because of panic.

Such decisions can result in buying at higher valuations and exiting at lower prices. Chasing recent performers without understanding their business fundamentals can create additional risks. Another common mistake is changing an investment strategy whenever the market becomes volatile.

This can prevent investors from benefiting from long term investment opportunities. Ultimately, earning market returns and actually capturing those returns are two different challenges.

6. How Should Investors Evaluate Their Portfolio?

Instead of comparing portfolio performance with the Nifty every day, investors should evaluate their investments through a broader framework.

  • Choose the right benchmark: A large cap portfolio can be compared with the Nifty 50 TRI, while mid-cap and small-cap portfolios may require more suitable benchmarks.
  • Evaluate risk alongside returns: Look beyond absolute returns and assess volatility, maximum drawdown and concentration risk. A portfolio generating slightly lower returns with lower downside risk may still suit an investor’s objectives.
  • Review asset allocation: Check whether too much capital is invested in one company, sector or investment theme. Diversification can help reduce dependence on individual holdings.
  • Consider the investment horizon: Short-term performance differences may reflect market cycles rather than long-term portfolio quality. Evaluate investments over a period that matches your financial goals.

7. Why Data-Driven Portfolio Analysis Matters

A portfolio should not be judged only by whether it beats the Nifty. Investors also need to understand which holdings are generating returns, where risks are concentrated and whether their investments remain aligned with their financial objectives.

Data-driven investment research can help investors assess company fundamentals, monitor portfolio risks and identify areas that require attention. Platforms such as Jarvis Invest use AI-powered analysis and market intelligence to support investment research and portfolio risk assessment.

The Bottom Line

The Nifty 50 reflects the performance of a specific group of large companies, while your portfolio reflects your individual investment decisions. Stock selection, sector allocation, investment timing, dividends, costs and investor behaviour can all create differences in returns.

Rather than focusing only on beating the index, investors should aim to build portfolios aligned with their financial goals, risk appetite and investment horizon. A successful investment strategy is not just about generating higher returns; it is also about managing risks and staying disciplined through changing market conditions.

If your portfolio keeps lagging a suitable benchmark, start by looking at the holdings that account for most of the difference and how much of your money is concentrated in them. A Jarvis Portfolio Health Check can help you review your existing stock holdings and identify portfolio risks. Check your portfolio with Jarvis Invest.

If you’re looking to build a personalised long-term stock portfolio, explore Jarvis Portfolio.

Disclaimer: The information, data, charts and company references presented in this article are compiled from publicly available sources believed to be reliable. While reasonable efforts have been made to ensure accuracy, Jarvis Invest does not guarantee the completeness, accuracy or timeliness of the information. This content is intended solely for educational and informational purposes and should not be construed as investment, financial or trading advice. Investments in securities are subject to market risks. Please conduct your own research or consult a SEBI Registered Investment Advisor before making any investment decision. Jarvis Invest is a SEBI Registered Investment Adviser (Registration No. INA000013235). Past performance is not indicative of future results.
Tags: AI based stock trading Indiaai-powered portfolio managementbest stock market advisor in indiajarvis ailong term investmentlong term investment portfolio Indialong term stocksSEBI Registered Investment Advisorshare market advisorstock market aistock portfoliostock portfolio analysisStock Portfolio Builder
Sumit Chanda

Sumit Chanda

Sumit has 18 years of experience in BFSI industry, into devising strategy for various functions, Investments and Managing Asset Portfolios. Specializes in Strategy & implementation in sales & operations, Team management, IT implementation, Affiliations.

Leave a Reply Cancel reply

Your email address will not be published. Required fields are marked *

Get access to AI-picked stock ideas, market insights and research updates daily tailored to your investing style.

Popular Posts

  • Nifty vs the average investors portfolio   why returns can look different
    Nifty vs the Average Investor’s Portfolio – Why Returns Can Look DifferentNovember 19, 2026
  • Banner for a stock market news video date 19 november 2026 title top 8 stock market news you need to know with a bull statue finance buildings and chart backdrop
    Stock Market News Update – 19th November, 2026November 19, 2026
  • Is portfolio management worth it for a ₹25 lakh portfolio
    Is Portfolio Management Worth It for a ₹25 Lakh Portfolio?November 19, 2026
  • How many stocks should an hni portfolio hold
    How Many Stocks Should an HNI Portfolio Hold?November 18, 2026
  • Top 8 stock market news you need to know banner with finance graphics a gold bull statue and stock charts in blue and white
    Stock Market News Updates – 18th November, 2026November 18, 2026

Recent Posts

  • Nifty vs the Average Investor’s Portfolio – Why Returns Can Look Different November 19, 2026
  • Stock Market News Update – 19th November, 2026 November 19, 2026
  • Is Portfolio Management Worth It for a ₹25 Lakh Portfolio? November 19, 2026
  • How Many Stocks Should an HNI Portfolio Hold? November 18, 2026
  • Stock Market News Updates – 18th November, 2026 November 18, 2026

Browse by Category

Jarvis Invest

India's AI-powered, SEBI-registered investment advisory — research, portfolios and global market intelligence for every investor.

Company

  • About Us
  • FAQs
  • Contact Us
  • Become a Partner

Products

  • Jarvis Portfolio
  • Jarvis Protect
  • Jarvis OneStock
  • Jarvis Prime
  • Sentiment Tracker (F&O)
  • US Multi-Asset Portfolio

Explore Topics

  • Equity Markets
  • Investing Basics
  • AI for investing
  • Trending Stock Market News: Quick Reads
  • Financial Planning
  • Portfolio Management
  • Stock Market News Updates
  • Global Stock Market

Get in touch

Customer support customersupport@jarvisinvest.com

Jarvis Invest — SEBI Registered Investment Adviser (Reg. No. INA000013235) & SEBI Registered Research Analyst (Reg. No. INH000018762). Investments in the securities market are subject to market risks. Read all the related documents carefully before investing. Registration granted by SEBI and certification from NISM in no way guarantee performance of the intermediary or provide any assurance of returns to investors.

© 2026 Jarvis Invest. All rights reserved.

  • Privacy Policy
  • Terms & Conditions
  • Disclaimer
Categories
Equity MarketsGet latest insights on the Indian equity market including stock trends, market analysis, sector…Investing BasicsLearn stock market basics including investing fundamentals, equity concepts, and beginner-friendly guides to start…AI for investingStay ahead with AI-powered stock insights, trend analysis, and intelligent investing strategies for ai…Trending Stock Market News: Quick ReadsDiscover the latest trends in the stock market with insightful blogs from Jarvis Invest…Portfolio ManagementExpert insights on portfolio management, asset allocation, risk management, and strategies to optimise best…Stock Market News UpdatesGet daily stock market news updates, key market movements, and insights that matter to…Global Stock MarketGet latest global stock market news, trends, and AI-driven stock insights on US, Europe…Stock AdvisoryLearn how AI-powered stock advisory and expert market research can help you build wealth.
I Am A
BeginnerBeginner-friendly stock market guides covering investing basics, common mistakes, and simple strategies to build…IntermediateIntermediate-level stock market insights covering investment strategies, portfolio analysis, and market concepts for informed…
Products
Jarvis PortfolioModel portfolio matched to your risk profile for long-term wealth creation.Jarvis ProtectContinuous portfolio monitoring for your existing portfolio with timely sell alerts to help manage downside risk.Jarvis OneStockHigh-conviction stock recommendations designed for short-term investing.Jarvis Prime - For HNIs & UHNIsPremium portfolio management services for investors with ₹25 lakh+ investment corpus.Jarvis Sentiment Tracker - AI Tool for F&OReal-time market sentiment analysis and trading signals for options traders.Jarvis US Multi-Asset PortfolioDiversified US portfolio investing across stocks and ETFs with automated portfolio management.Jarvis AtlasInvestment opportunities across Indian equities, global markets, and commodities in 10+ global markets.
No Result
View All Result
  • CATEGORIES
    • Equity Markets
    • Investing Basics
    • AI for investing
    • Trending Stock Market News: Quick Reads
    • Portfolio Management
    • Stock Market News Updates
    • Global Stock Market
    • Stock Advisory
  • I AM A
    • Beginner
    • Intermediate
  • Home
  • Products
    • Jarvis Portfolio
    • Jarvis Protect
    • Jarvis OneStock
    • Jarvis Prime – For HNIs & UHNIs
    • Jarvis Sentiment Tracker – AI Tool for F&O
    • Jarvis US Multi-Asset Portfolio
    • Jarvis Atlas
  • FAQs
  • About Us
  • Contact Us
  • Become a Partner

© 2023 Jarvis Invest

Go to mobile version